Reminder: Conditional Breakpoints are Slow
Perhaps it’s obvious that conditional breakpoints in LLDB add noticeable execution latency, but it was a lesson I needed to relearn. And relearning this lesson is fun debugging story to share.
The context of this story is specifically Swift Error breakpoints, which obscured the root cause of the issue long enough to cause me some serious emotional damage. Despite the lasting trauma, it was a happy ending because the fix required no code changes and no emergency app submissions.
TL;DR
Swift Error breakpoints with type filters or conditions can dramatically slow down execution when errors are thrown in a tight loop.
- Disable conditional Swift Error breakpoints when you are not actively debugging with them.
- Consider not using error handling for control flow in cases where the error handling could end up in a tight loop.
Issue and symptoms
During normal development, I noticed slow startup and noticeable hitching when navigating to and from screens that made database fetches. However, outside the normal build/run cycle, the hitching would disappear and the app would run quickly and smoothly.
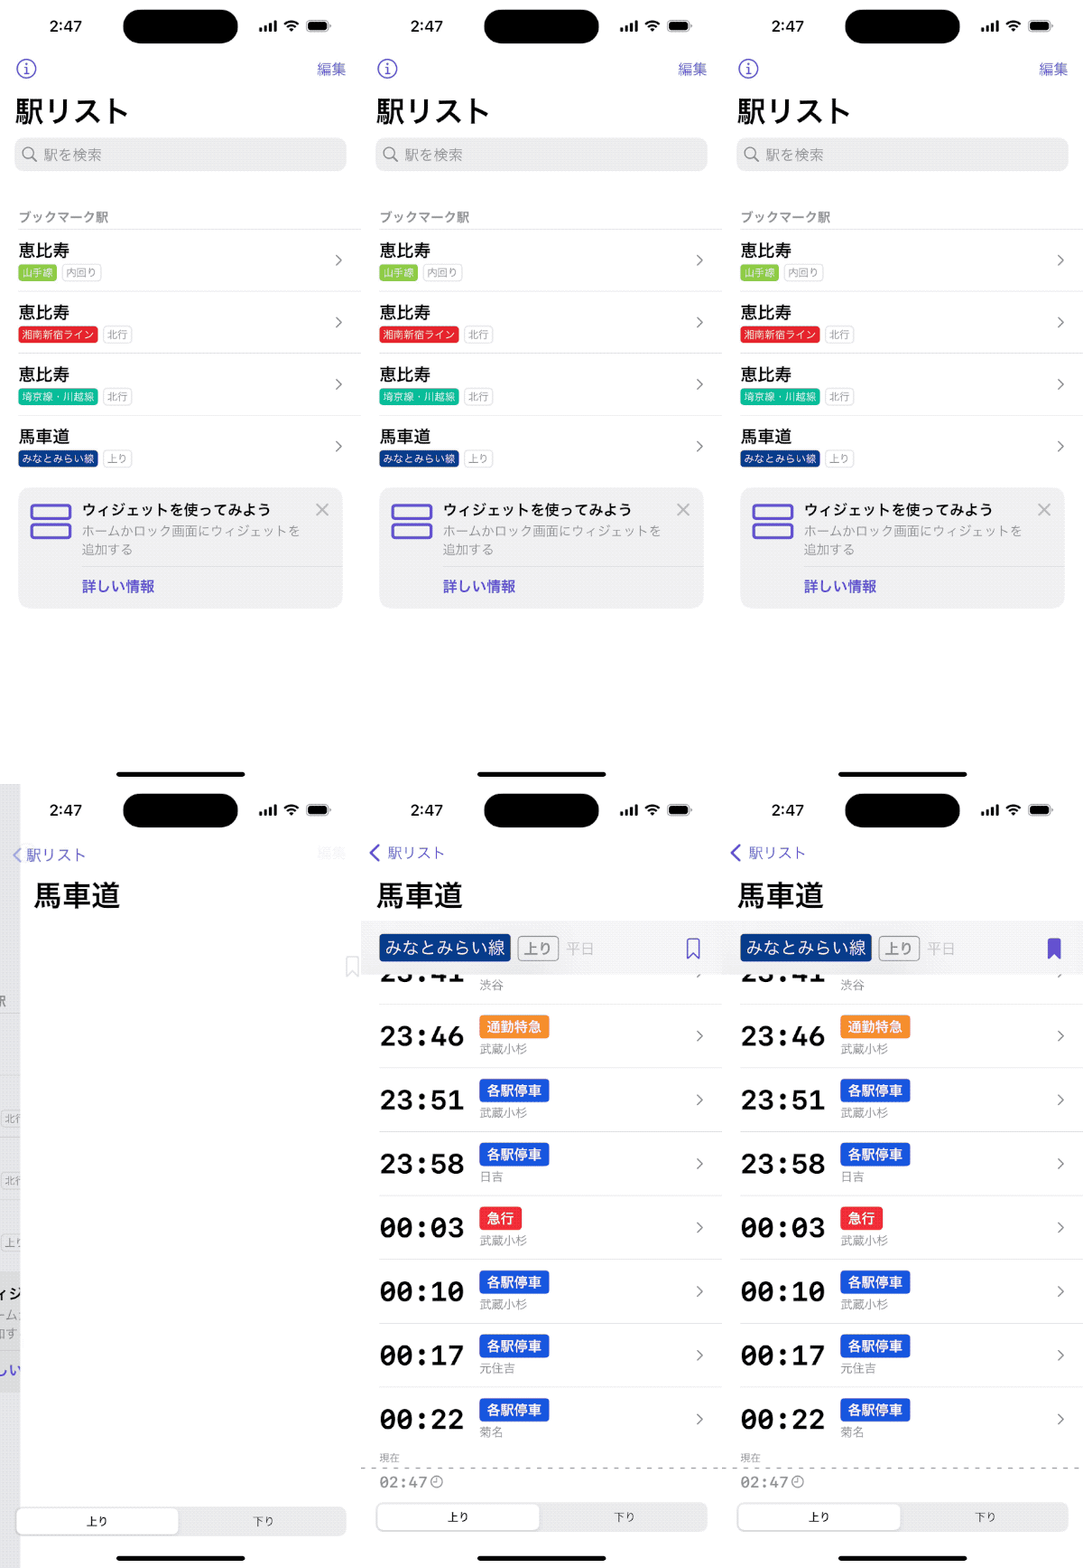
The problem appeared somewhat randomly and at first was not severe enough to disrupt my usual development cycle outside being a little annoying.
After adding more features, the problem gradually became so pronounced that I could no longer debug normally. I would build and run to install the app, then immediately stop debugging and re-launch the app in order to continue testing.
I did some light investigation throughout the subsequent weeks of development, but I never spent enough time to discover the root cause as I wanted to focus on shipping Eki Bright to the App Store. At this point I had only confirmed that the issue was present:
- In both Debug and Release build configurations.
- In both the iOS simulator and on device.
Root cause
Before diving into the full story, a TL;DR on root cause of the issue.
Swift Error breakpoints
Xcode/LLDB has a useful breakpoint type for Swift errors. A fresh Swift Error breakpoint will pause execution when any error is thrown.
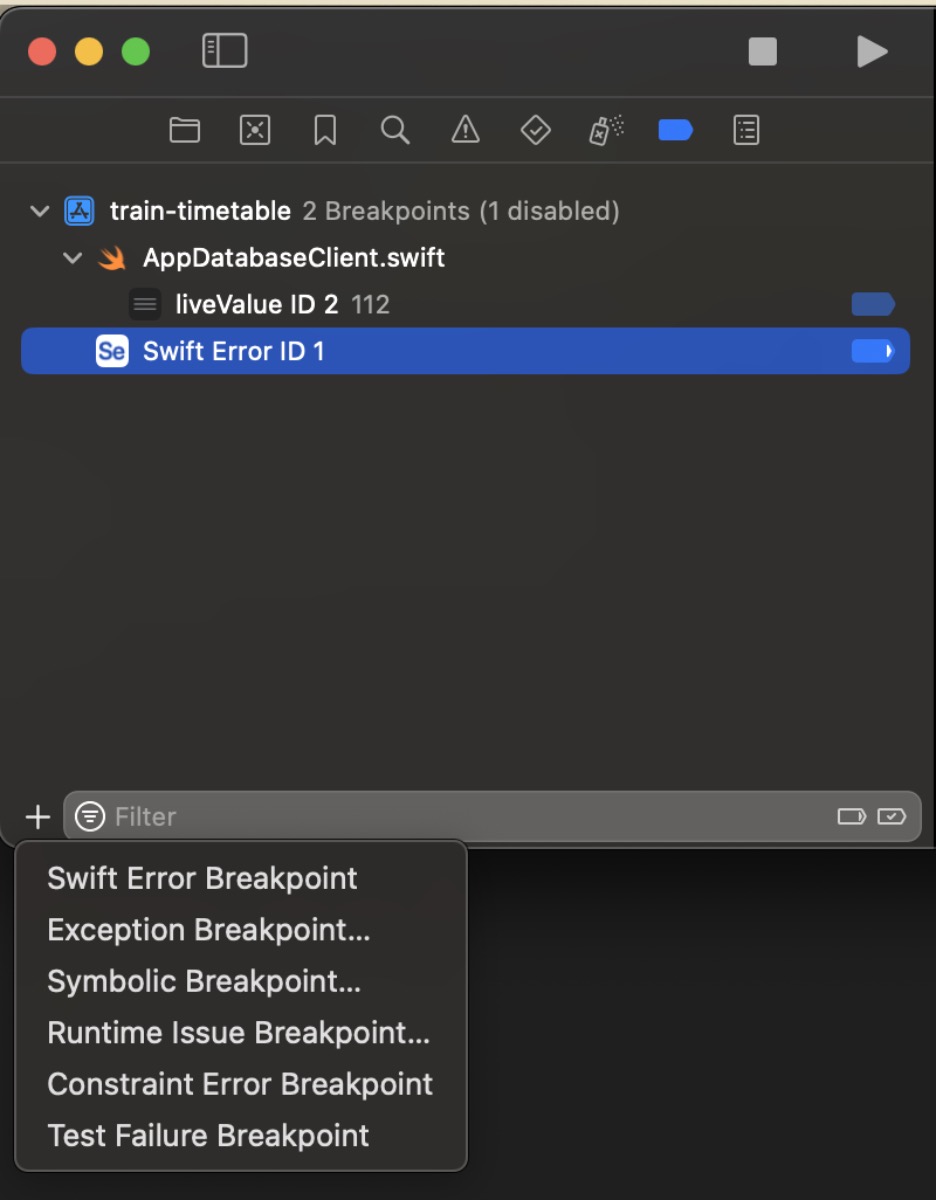
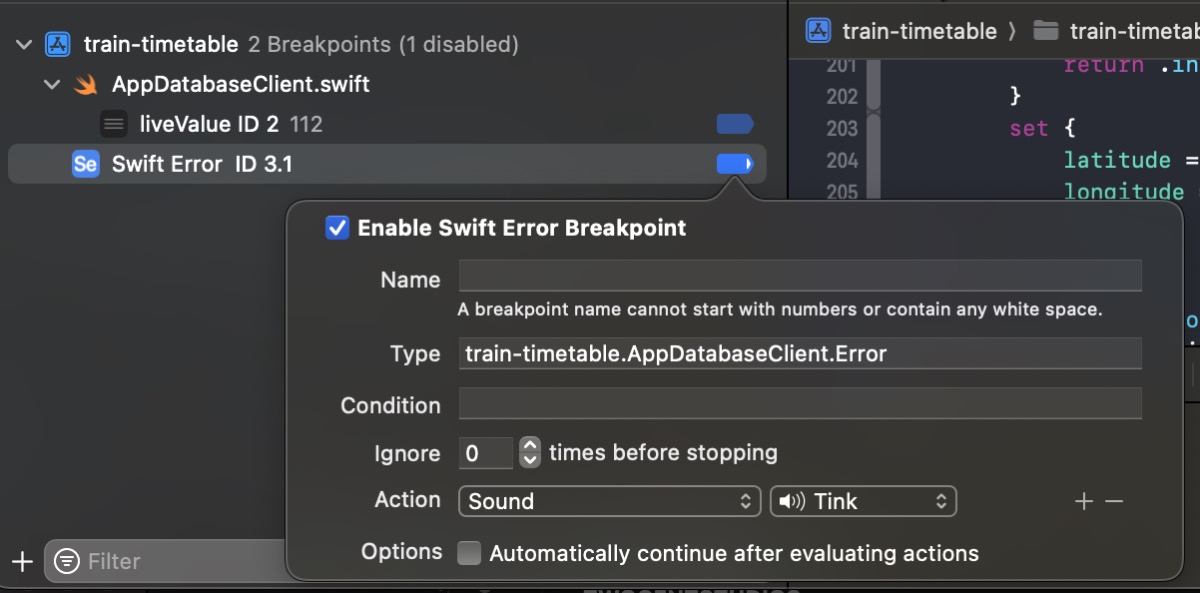
Additionally, a Swift Error breakpoint can be conditional to a specific error type.
GRDB
GRDB is a “toolkit for SQLite databases”.
GRDB has a useful feature called Codable Records alongside JSON Columns.
When a Codable record contains a property that is not a simple value (Bool, Int, String, Date, Swift enums, etc.), that value is encoded and decoded as a JSON string.
This feature makes it simple and boilerplate-free to use embedded JSON in the context of traditional SQL tables.
Deep in the implementation details, GRDB uses Swift errors to fall back to JSON decoding when a column is not decodable as a simple value.
// GRDB/Record/FetchableRecord+Decodable.swift

/// The decoder that decodes from a database column
private struct ColumnDecoder<R: FetchableRecord>: Decoder {
    // ...

    func container<Key>(keyedBy type: Key.Type) throws -> KeyedDecodingContainer<Key> {
        // We need to switch to JSON decoding
        throw JSONRequiredError()
    }
}

/// The decoder that decodes a record from a database row
private struct _RowDecoder<R: FetchableRecord>: Decoder {
    // ...
    class KeyedContainer<Key: CodingKey>: KeyedDecodingContainerProtocol {
        // ...

        private func decode<T>( _ type: T.Type, fromRow row: Row, columnAtIndex index: Int, key: Key) throws -> T where T: Decodable {
            do {
                // This decoding will fail for types that decode from keyed
                // or unkeyed containers, because we're decoding a single
                // value here (string, int, double, data, null). If such an
                // error happens, we'll switch to JSON decoding.
                let columnDecoder = ColumnDecoder<R>(row: row, columnIndex: index, codingPath: codingPath + [key])
                return try T(from: columnDecoder)
            } catch is JSONRequiredError {
                // Decode from JSON
                return try row.withUnsafeData(atIndex: index) { data in
                    guard let data else { throw DecodingError.valueNotFound(Data.self, DecodingError.Context(codingPath: codingPath + [key], debugDescription: "Missing Data")) }
                    return try R.databaseJSONDecoder(for: key.stringValue).decode(type.self, from: data)
                }
            }
        }
    }
}
JSONRequiredError is used for control flow. When decoding dozens of rows with several JSON columns, this error will be thrown hundreds of times from ColumnDecoder but caught and handled immediately in the caller _RowDecoder.
Swift Error breakpoint + GRDB
Each time GRDB would throw a JSONRequiredError, the debugger would check a Swift Error breakpoint with the unrelated type filter train-timetable.AppDatabaseClient.Error I had set during feature development and forgotten about.
Since the throw-error-check-breakpoint procedure happened hundreds of times for certain queries, the result was a noticeable lag that appeared in the UI more and more as I added more features to the app and therefore database fetches.
Fix
The fix was literally just disabling the Swift Error breakpoint.
Full debugging story
Although I do not enjoy living through a good debugging story, I enjoy telling a good debugging story.
Documenting your bug investigation can feel slow, but it helps so much in retrospect to develop better instincts for next time. Doing so in a simple text log allowed me to write the following tale as it actually happened.
Measuring
My first step was narrowing down which area of the code was affected. Although almost all screens in my app use the database, the About screen does not, and did not show any sort of hitches.
I re-ran a measurement test on both device and simulator that I had previously written.
func testMeasureDatabaseFetch() async throws {
    measure {
        let client = AppDatabaseClient.liveValue
        let exp = expectation(description: "")
        Task {
            let response = try await client.fetchStationTimetable(stationID: .init("Minatomirai.Minatomirai.Bashamichi"), railDirection: .inbound, scheduleSelector: .weekday)
            exp.fulfill()
        }
        wait(for: [exp])
    }
}
I confirmed that this simple fetch was taking between 1.5 and 3.0 seconds when there’s no way it should be taking more than 0.01 seconds.
I enabled database tracing in GRDB.
let dbLogger = Logger(subsystem: Bundle.main.bundleIdentifier!, category: "db")
var config = Configuration()
config.prepareDatabase { db in
    db.trace(options: .profile) { event in
        if case let .profile(statement, duration) = event, duration > 0.5 {
            dbLogger.warning("Slow query: \(event)")
        }
    }
}
This helped me keep an eye on query times throughout my investigation.
Poking the database
Slow query: 1.491s SELECT * FROM "station" WHERE "id" IN (?, ?, ?, ?, ?, ?, ?, ?, ?, ?, ?, ?, ?, ?, ?, ?, ?, ?, ?, ?, ?, ?, ?, ?, ?, ?, ?, ?, ?, ?, ?, ?, ?, ?, ?, ?, ?, ?, ?, ?, ?, ?, ?, ?, ?, ?, ?, ?, ?, ?, ?, ?, ?, ?, ?, ?, ?, ?, ?, ?, ?, ?, ?, ?, ?, ?, ?, ?, ?, ?, ?, ?, ?, ?, ?, ?, ?, ?, ?, ?, ?, ?, ?, ?, ?, ?, ?, ?, ?, ?, ?, ?, ?, ?, ?, ?, ?, ?, ?, ?, ?, ?, ?, ?, ?, ?, ?, ?, ?, ?, ?, ?, ?, ?, ?, ?, ?, ?, ?, ?, ?, ?, ?, ?, ?, ?, ?, ?, ?, ?, ?, ?, ?, ?, ?, ?, ?, ?, ?, ?, ?, ?, ?, ?, ?, ?, ?, ?, ?, ?, ?, ?, ?, ?, ?, ?, ?, ?, ?, ?, ?, ?, ?, ?, ?, ?, ?, ?, ?, ?, ?, ?, ?, ?, ?, ?, ?, ?, ?, ?, ?, ?, ?, ?, ?, ?, ?, ?, ?, ?, ?, ?, ?, ?, ?, ?, ?, ?, ?, ?, ?, ?, ?, ?, ?, ?, ?, ?, ?, ?, ?, ?, ?, ?, ?, ?, ?, ?, ?, ?, ?, ?, ?, ?, ?, ?, ?, ?, ?, ?, ?, ?, ?, ?, ?, ?, ?, ?, ?, ?, ?, ?, ?, ?, ?, ?, ?, ?, ?, ?, ?, ?, ?, ?, ?, ?, ?, ?, ?, ?, ?, ?, ?, ?, ?, ?, ?)
The first thing I noticed was that I was erroneously submitting way too many keys to the query when doing my ad-hoc database joins. However, after uniquing the keys, the query time didn’t change. After all, if that were the issue I’d see it in production too.
I thought perhaps reading the database from the bundle could be the problem. But that setup is tacitly endorsed in the GRDB quickstart. And again, I’d presumably see this problem in production.
In fact, almost all the hypotheses I had at first didn’t make sense when considering this problem only appeared in the build/run cycle.
Another symptom I noticed due to the database logging was that the EntityQuery I’d added when creating the widget extension was being called several times during app launch. This explained why app launch became unbearably slow at some point.
The debugger
At this point, I decided to fire up Instruments and do some profiling. But I couldn’t reproduce the problem with the default Instruments setup. I even changed the build configuration from the default of Release to Debug and still no change.
This was my first clue that the debugger was involved. But how could I confirm this? Well, I found two ways.
The first was disabling the Debug executable option in the Scheme settings under Run.
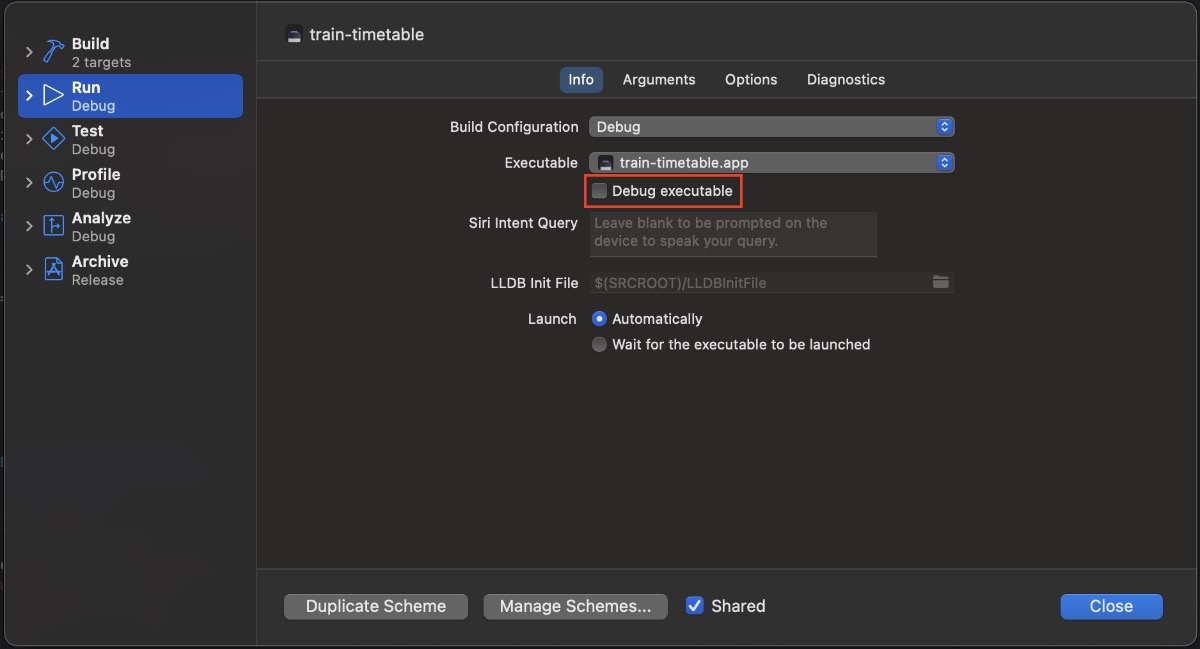
Without the debugger attached, the issue was fixed! This was a useful discovery. If I had to stop here, I could at least workaround the issue at the cost of not being able to use the debugger.
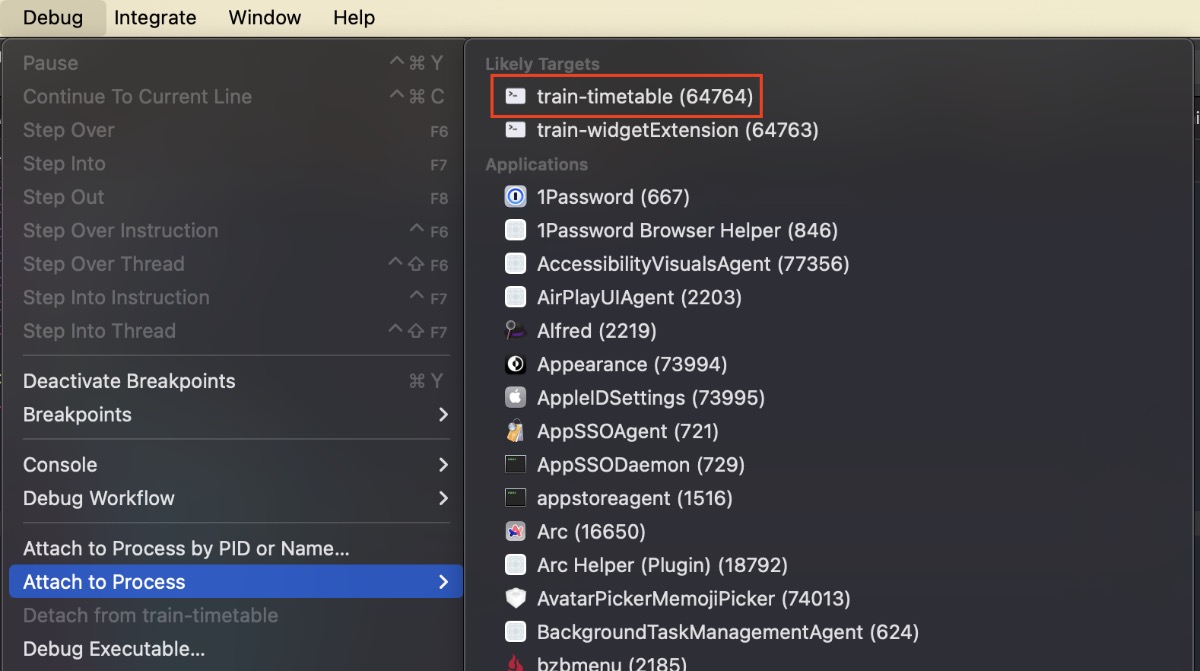
The second confirmation of the debugger’s role in the issue would be useful later on in the investigation. It turns out you can manually attach a debugger to an app being profiled in Instruments.
Rabbit holes
I’d like to say at this point I quickly narrowed down the problem even further. But unfortunately, I went down some unrelated rabbit holes. Yet those rabbit holes eventually led me to another useful discovery.
A few stray pieces of advice I noticed while Googling prompted me to completely purge derived data, but that made no difference. I’d done this previously when testing whether the issue was fixed in Xcode 16 beta (it was not).
I dug deeper into the extensive GRDB docs.
- I tried switching from
DatabaseQueuetoDatabasePool. No change. - I tried switching from
db.readtodb.unsafeRead(andconfig.allowsUnsafeTransations). No change. - I tried adding
awaitin front ofdb.read. No change. - I stepped through the execution of
Station.fetchAll(_:keys:)and didn’t see anything too strange.
I changed my database calls to fetch all results (~2000) instead of just those for a few keys. The fetch time went up from 3 seconds to 30 seconds. This was actually a good clue that the slowdown scaled linearly with the number of results. Although I didn’t yet know what that meant.
I successfully attached the debugger to the app while profiling in Instruments. Strangely, I saw long calls to read, but the trace went dead there. Plus, the raw function duration values/weights looked normal. Instruments also highlighted a long hang during that period, which re-raised another lingering question: why was the UI hanging when the entire database fetch was happening on a background queue?.
Returning to the normal debugger, the extra long query generated by fetching all stations allowed me to pause execution during the database fetch. I had to hammer on the pause button in Xcode for it to “catch”, but when it did, I usually ended up in the ColumnDecoder struct mentioned earlier:
/// The decoder that decodes from a database column
private struct ColumnDecoder<R: FetchableRecord>: Decoder {
    // ...

    func container<Key>(keyedBy type: Key.Type) throws -> KeyedDecodingContainer<Key> {
        // We need to switch to JSON decoding
        throw JSONRequiredError() /// <--- execution usually paused here
    }
}
When pausing execution randomly as opposed to using a breakpoint, you can’t rely on landing in a relevant section of the code. However, in this case, stepping through and exploring this section of GRDB source showed me two important points:
- GRDB was intentionally using errors for control flow.
- I should look into GRDB’s JSON column decoding support.
GRDB’s JSON column decoding support
I noticed my Station model had two JSON columns, one of which I’d added later in development (in retrospect, another decision that unwittingly exacerbated the slowdown).
public struct Station: Identifiable, Equatable, Codable, PersistableRecord, FetchableRecord, Sendable {
    // ...
    let title: TitleLocalization
    let railDirections: Set<RailDirection>
}
TitleLocalization is a super simple two-String struct and RailDirection is an enum.
struct TitleLocalization: Equatable, Codable, Sendable {
    let en: String
    let ja: String
}

public enum RailDirection: String, Identifiable, Equatable, Codable, CaseIterable, Comparable, Sendable {
    case inbound = "Inbound"
    case outbound = "Outbound"
    // ...
}
I disabled temporarily decoding for these two columns by setting their values to constants.
public struct Station: Identifiable, Equatable, Codable, PersistableRecord, FetchableRecord, Sendable {
    // ...

    let title: TitleLocalization = .init(en: "test", ja: "test")
    let railDirections: Set<RailDirection> = [.inbound, .outbound]
}
Disabling decoding for the JSON columns fixed the slowdown! This was another big breakthrough.
So to summarize, at this point I had the following facts:
- The Instruments time profile looked normal besides the hang.
- The debugger was involved somehow.
- GRDB’s JSON column decoding support was involved somehow.
Not just the debugger, but also breakpoints
I knew the debugger was my enemy, but I was now using it heavily to pause, step in and out and over code, and set breakpoints.
At one point while stepping through GRDB code, I thought I was losing my mind. In my normal course of debugging I’d clicked the little “disable breakpoints” button in Xcode debug area header. Sometime later I noticed I could no longer reproduce the slowdown no matter what code I added or removed.
Luckily I connected the dots and realized that it was disabling breakpoints that solved the slowdown. I’d successfully narrowed down the problem from debugger to breakpoint. But now what? Googling “how are breakpoints implemented in LLDB” was obviously a dead end.
Back to GRDB
In my two front war, I switched back to focusing on GRDB. I re-read the docs and tried a few small code tweaks to see if it was a model configuration problem on my end. After all, I’d written a lot of this code several months ago and probably moved on once it apparently worked.
- I tried adding
FetchableRecordconformance toTitleLocalization, but that didn’t change anything and it didn’t make sense anyway. - I tried adding manual
Codableimplementations to bothTitleLocalizationandStation. No change. - I tried adding my own
JSONDecodertoStationvia thestatic func databaseJSONDecoder(for column: String) -> JSONDecodermethod on theFetchableRecordprotocol. No change.
I tried manually decoding the TitleLocalization with my own one-off JSONDecoder instance.
public struct Station: Identifiable, Equatable, Codable, PersistableRecord, FetchableRecord, Sendable {
    // ...
    public init(from decoder: Decoder) throws {
        let container = try decoder.container(keyedBy: CodingKeys.self)
        // ...
        let titleString = try container.decode(String.self, forKey: .title)
        let titleData = titleString.data(using: .utf8)!
        title = try JSONDecoder().decode(TitleLocalization.self, from: titleData)
    }
}
This is a bit unintuitive because the top-level decoder from Station is not a JSONDecoder; it’s a custom decoder from GRDB to decode a row of SQL data. I’m then manually creating a JSONDecoder to decode the raw string column as a TitleLocalization.
Somewhat as expected, bypassing the error-throwing logic in GRDB and using my own JSON decoding solved the slowdown.
Reconnaissance and Rest
I’d been investigating for about 6 hours straight and was starting to lose my mind, yet I felt so close to finding the underlying problem.
At this point I was considering a few paths forward for the next day:
- Workaround: give up using breakpoints indefinitely.
- Workaround: rewrite my model layer’s
Codablesupport to manually decode all JSON columns, but inDEBUGmode only. - Ask for help: create a sample project that showed a minimal reproduction of the bug and share it in an Issue on the GRDB GitHub repo.
- Forge ahead: continue investigating on my own.
Before I hung it up for the day I wrote and shared a short cry-for-help post on Mastodon.
While writing the Mastodon post, I realized that I could leave the breakpoints feature enabled, but disable the individual breakpoints in the breakpoint panel and the slowdown was solved. This led me to notice I had left a Swift Error breakpoint on that I’d must have added several weeks back and forgot about.
Exasperated, I shared a few of the salient discoveries to my friend and fellow iOS dev Dave Fox. He asked:
So it’s purely down to that custom [Swift Error] breakpoint?
Without checking because I was now away from the computer, I responded, no, it was any breakpoint.
I had dinner and went to bed, the investigation still stewing somewhere in the back of my mind.
The solution
I woke up in the middle of the night and in a delirious state and the two pieces of the puzzle had suddenly come together.
- I actually hadn’t checked whether it was only the Swift Error breakpoint that caused the slowdown (triggered by Dave’s question).
- The GRDB JSON column decoding implementation throws errors as normal control flow.
- The number of errors thrown by GRDB would increase linearly with the number of rows and JSON columns.
- My decoding workaround did not throw any errors.
I got up and went to the computer and turned off the Swift Error breakpoint while leaving the other breakpoints on. The slowdown was fixed.
The solution finally made sense: LLDB conditionally type checking every error thrown by GRDB during JSON column decoding was taking significant time and adding up enough to be noticeable. Even though the decoding was happening off the main queue, the debugger was still locking up the entire app while it was processing the breakpoint.
And thus, I solved the underlying problem. The problem caused no issues for my end users (besides slowing down my ability to ship new features) and required no code changes. I literally just needed to delete a breakpoint.
Retrospective
At this point I look back and wonder, could I have solved this earlier? What heuristics can I incorporate into my future debugging investigation procedure? What can I do to proactively prevent an issue shaped like this in the future?
A bug with the debugger as the root cause was new to me. I think it showed a weakness in my overall understanding of LLDB. Based on my awareness that Release builds are always faster than Debug builds (and this issue from the GRDB repo, seemingly resigning to that fact), my assumption was that the root cause was the Debug build configuration. Although following that thinking, that couldn’t have been it because there was no slowdown after the debugger was detached.
Another ambiguous point I should have clarified early on in the investigation: did the query trace times reported by SQLite include only time spent inside the SQLite library or did they also include time spent in GRDB while a TRANSACTION was still open? The answer was the latter, and knowing that definitively would have allowed me to investigate GRDB internals with more confidence.
The rabbit holes I went down were time consuming, but ultimately, pulling any string was enough to stumble upon insights that got me to the solution.
The quickest path to the solution would have been:
- The slowdown does not occur when debugging with Instruments in the Debug build configuration.
- → must be related to the debugger.
- The slowdown does not occur when Xcode does not attach the debugger.
- → debugger-related confirmed.
- The slowdown does not occur when breakpoints are disabled at runtime.
- → must be related to breakpoints.
- The slowdown does not occur when breakpoints are enabled but no individual breakpoints are disabled.
- → must be an individual breakpoint.
- The slowdown does not occur when a normal breakpoint is enabled but a conditional breakpoint is not enabled.
- → must be the conditional breakpoint.
- The slowdown occurs when only the conditional breakpoint is enabled.
- → conditional breakpoint root-cause confirmed.
The big missing piece in being able to jump to each conclusion was the understanding of what components make up a debugger?
If I would have thought: “A debugger’s primary component tools are viewing memory, viewing thread state, viewing the stack frame, setting breakpoints, setting watchpoints, and executing statements”, it may then have been obvious, either right away or through process of elimination, that a way the debugger could directly affect execution was through breakpoints or watchpoints.
Ultimately, I think most programmers feel instinctual dread when they suspect the bug they’re investigating changes its behavior when it’s being observed. The quantum nature of these bugs is why we call them Heisenbugs.
Even though I was admittedly slow in connecting the dots along the debugger line of inquiry, I do give myself credit for recognizing that GRDB was using errors for control flow and filing that away as notable in the back of my head.
Perhaps I should have jumped first to trying to reproduce the slowdown in a clean room project. However, in this particular case I believe that approach would have been counterproductive and taken longer to find the root cause. The clean room project would have taken time to build up to the complexity of main app, and at that point would still not have any chance of recreating the issue (because I would not have noticed the offending breakpoint still in the main app).
This experience was a good opportunity to spelunk through the docs and extensive codebase of GRDB. Spelunking through unfamiliar codebases is itself a muscle that must be stretched regularly.
It would have been nicer to have solved this issue in one hour instead of six (plus the weeks I spent working around it). But I am satisfied I discovered the root cause in one session (plus sleep).
Conclusion
Hopefully you’ve stored this tidbit about the relative slowness of conditional breakpoints away in your memory alongside all the other great Xcode trivia, and you’ll recognize this issue immediately should you ever come across it. Hopefully you enjoyed the story, and I hope I don’t have another one like it for a while.