Probability Distributions of Image Data
This post discusses more details about how to use deconstructors, the first module of the turning-an-image-into-an-original-piece-of-music project I outlined in this post. Skim that post first to understand the goal of the project. Then read about deconstructors in this post
In doing some prototyping of a simple image to music transformer, I started finding that my intuition of what various deconstructed image data looked like was off (it was probably off because I didn’t have any intuition at all). This fact manifested in my algorithmically generated drumlines always being the same regardless of the images I chose as test inputs.
I realized that without some hard data on the probability distributions of the deconstructors in my virtual palette, my transformers would not do a good job in producing unique music.
So without further adieu, let’s fire up the statistics engine and go to work.
Gathering data
As outlined in my previous post on transformers, I narrowed down the potential input space of all possible CGImages into the more reasonable space of a common user’s iOS Camera Roll. Checking my own Camera Roll, I found 2,242 photos dating back a little over a year (I periodically dump them to a NAS for long term storage). With a good mix of photos and screenshots, this seems like a decent place to start.
We’re going to have to write some code to exercise our previously written deconstructors. We’ll call our class PhotoDataAggregator and import Photos.Framework to gain access to my Camera Roll.
Let’s first write a generic function that will fetch all photos, apply an arbitrary function to each photo in turn, and aggregate the results.
Note: since this is not shipping code, I’ll be force unwrapping and force
trying. Don’t judge.
static func tranformPhotos<T>(fromImageManager imageManager: PHImageManager, transform: @escaping ((UIImage) -> T)) -> [T] {
    let fetchOptions = PHFetchOptions()
    let fetchResults = PHAsset.fetchAssets(with: .image, options: fetchOptions)

    var transformed: [T] = []

    fetchResults.enumerateObjects({ (asset: PHAsset, i: Int, stop: UnsafeMutablePointer<ObjCBool>) in
        let size = CGSize(width: 50, height: 50)
        let options = PHImageRequestOptions()
        options.isSynchronous = true
        options.deliveryMode = .fastFormat
        options.resizeMode = .exact
        imageManager.requestImage(for: asset, targetSize: size, contentMode: .aspectFill, options: options, resultHandler: { (image, options) in
            let transformResult = transform(image!)
            transformed.append(transformResult)
        })
    })

    return transformed
}
Now we can pass any of our deconstructor functions (with a little massaging) to this function. Three representative examples are below.
static func averageGrayTransform(image: UIImage) -> Normalized {
    let imageData = try! image.cgImage!.imageData()
    let result = imageData.averageGray()
    return result.gray
}

static func averageRGBTransform(image: UIImage) -> [Normalized] {
    let imageData = try! image.cgImage!.imageData()
    let result = imageData.averageRGB()
    return result.components
}

static func rowAverageHueTransform(image: UIImage) -> [Normalized] {
    let imageData = try! image.cgImage!.imageData()
    let results = imageData.rowAverageHSVs().map { $0.hue }
    return results
}
Our results with either be [Normalized] or [[Normalized]].
We’ll want to use a spreadsheet to analyze the data, so let’s make a couple quick CSV functions and a way to write this data to a file on the device.
static func arrayOfArraysToCSV<T: CustomStringConvertible>(arrayOfArrays: [[T]]) -> String {
    return arrayOfArrays.map { arrayToCSV(array: $0) }.joined(separator: "\n")
}

static func arrayToCSV<T: CustomStringConvertible>(array: [T]) -> String {
    return array.map { String(describing: $0) }.joined(separator: ",")
}

static func writeToFile(text: String, fileName: String) throws {
    if let dir = FileManager.default.urls(for: .documentDirectory, in: .userDomainMask).first {
        let path = dir.appendingPathComponent(fileName)
        try text.write(to: path, atomically: false, encoding: String.Encoding.utf8)
    } else {
        throw NSError.app("Could not find documents directory.")
    }
}
Great, now we just need some glue code to run all the deconstructors in parallel.
func run() {
    let imageManager = PHImageManager.default()

    DispatchQueue.global().async {
        let resultArray = PhotoDataAggregator.tranformPhotos(fromImageManager: imageManager, transform: PhotoDataAggregator.averageGrayTransform)
        let csv = PhotoDataAggregator.arrayToCSV(array: resultArray)
        try! PhotoDataAggregator.writeToFile(text: csv, fileName: "averageGray.csv")
    }

    // ... the rest of the deconstructors
}
Running this function pegs the CPU on my iPhone 6 at 200% for about 10 minutes.

Finally we’ve got some CSV files to analyze.
Analyzing the results
We have a lot of data to look at! We’re going to use a histogram to get a bird’s-eye view of what values constitute “average” and which are outliers.
I don’t spend my days in spreadsheet programs, so I’m admittedly a little iffy on best practices for this next part.
Numbers.app doesn’t have histogram support as far as I can tell, so I’m going to upload the data into Google Sheets. Unfortunately, Google Sheet has some resource limits we’ll run into, but it’ll get us most of the way there.
Average gray

This is probably the most straight-forward value we have. It’s unimodal around 0.4 with a fair amount of representation at the upper end too, almost certainly due to screenshots.
Average hue, saturation, value
HSV, also known as HSB, is a cylindrical color space. It’s easiest to explain with a figure, courtesy of Wikipedia.

Averaging the HSV colors of an entire photo might produce some unexpected results if we were observing it in the visual world. But in our case, it’s just another pseudo-random number that can be fed into our system.

Hue is interesting because since it’s not an intensity scale, we might expect the distribution to be even. However, we can see that the majority of our input set tends to scale towards the red/orange/yellow part of the spectrum.

Saturation is unimodal and sits on the low side on the intensity spectrum at around 0.3. I’d say this intuitively makes sense, as our world is not always radiating 100% vivid colors.
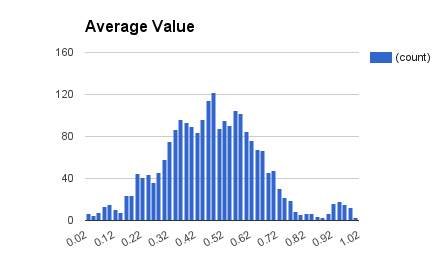
Value (aka brightness) looks similar to our average gray histogram with a unimodal peak around 0.5 and some outliers towards the high end.
Average red, green, blue
As intensity graphs, these also look similar to value/brightness. Interesting to note that overall red is greater than green, which is greater than blue.


Row average hue, saturation, value
If we divide our image up into rows and average each, what do we see a similar distribution?
There are a couple ways to look at this data since there’s a lot more of it. Unfortunately, if we try to clump it all together, Google Sheets can’t handle that volume of data. For now we’ll sample just the first row and middle row.


The first and middle rows look similar. Presumably we’d see a bit of variance across rows and columns.
Additional data
In the future, we can collect data from the other deconstructors (presuming we still have the same image data set).
What do we do with this information?
Knowing the approximate position of the central mode will allow us to select a more equal split point in our decision engine functions.
Some of our decision engine helper functions can only make binary decisions. Other helper functions (as presented in the musical key selection section of the transformers post), assume an equal distribution between buckets. From these newly attained statistics, we know that a normal distribution is most common and should be used instead.
Wrap up
We collected statistics about a representative images data set for the purpose of being able to better tune our decision engine functions. The primary goal of all of this is to enable us to produce more entropy in the pieces generated by our transformers.